Ceph Manager Dashboard v2
The original Ceph Manager Dashboard that was introduced in Ceph "Luminous" started out as a simple, read-only view into various run-time information and performance data of a Ceph cluster, without authentication or any administrative functionality.
However, as it turns out, there is a growing demand for adding more web-based management capabilities, to make it easier for administrators that prefer a WebUI to manage Ceph over the command line. Sage Weil also touched upon this topic in the Ceph Developer monthly call in December and created an etherpad with some ideas for improvement.
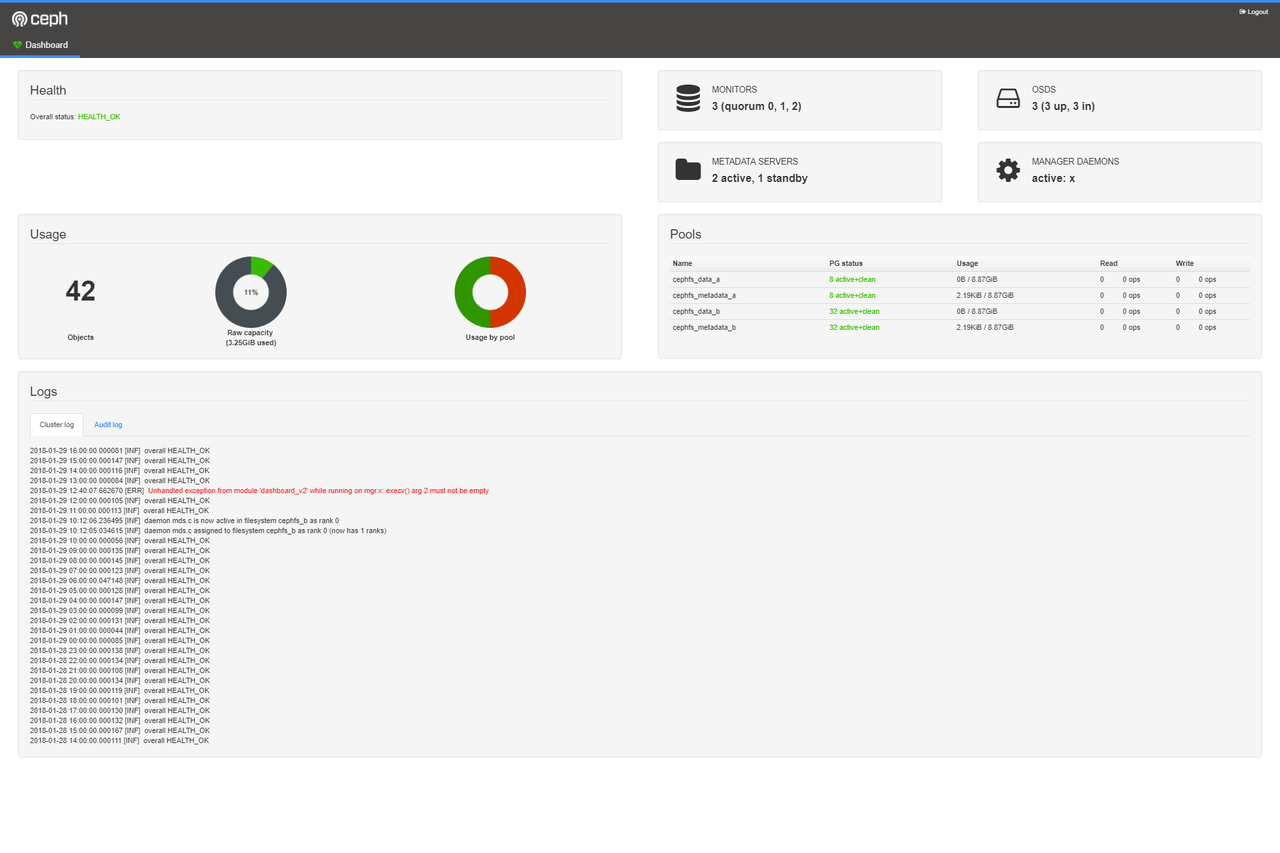
A preliminary screen shot of the Ceph health dashboard
After learning about this, we approached Sage and John Spray from the Ceph project and offered our help to implement the missing functionality. Based on our experiences in developing the Ceph support in openATTIC, we think we have a lot to offer in the form of code and experience in creating a Ceph administration and monitoring UI.
We started this endeavour by creating a prototype of the current dashboard, based on the Angular web development framework. While working on it, we proposed the following: we will go ahead and start a new Manager module, currently dubbed "dashboard_v2". The code and architecture of this module is inspired by and partially derived from the openATTIC architecture (both the backend and WebUI).
The development is actively driven by the openATTIC team. As a first milestone, we aim to migrate as much of the existing dashboard functionality as possible, while also building a foundation that supports porting existing functionality from openATTIC that is missing in the original dashboard (e.g. the possibility to add/edit/remove Ceph pools and RBDs, managing Ceph Object Gateway users and their access keys).
Some functionality provided by the standalone version of openATTIC depends on the Salt-based DeepSea framework (e.g. iSCSI target management and NFS share management), these features will be added at some later stage, hopefully in a more generic fashion.
We think that contributing both our code and developer time has a lot of benefits for the Ceph project and its users: a native, built-in management and monitoring application that will evolve over time. Being part of the upstream project repo allows for a much tighter integration and less overhead.
After laying out the initial groundwork, we announced our project on the ceph-devel mailing list last week.
In the video recording of Sage's LinuxConfAu presentation "Making distributed storage easy: usability in Ceph Luminous and beyond" you can get his take on the current dashboard and this future development (the dashboard part starts at 28m:08s):
We'll also be talking about this project in the Software Defined Storage Developer room at this weekend's FOSDEM conference in Brussels, Belgium, and at next week's Ceph Day in Darmstadt, Germany.
I've also submitted a talk about this for the upcoming Cephalocon in Beijing, China. Let's see if it will be accepted!
For the time being, the main development take place in a git branch wip-mgr-dashboard_v2, located in a fork of the Ceph git repository on github. Pull requests for the module are also managed on this fork, until the module has been merged upstream. We also openened a "WIP, DNM" pull request in the upstream Ceph git repo, so you can follow the ongoing development here.
What have we accomplished so far?
At the moment, we have an initial backend framework (based on CherryPy) in place and have started porting selected components from the openATTIC backend code. A WebUI scaffold based on the Angular framework has also been created. Some UI components e.g. a data table implementation are still being worked on (PR#30).
We're now working on populating the dashboard, by porting existing functionality from the orginal dashboard module by module. You can find some preliminary screenshots in our gallery.
Some examples of features that have been merged and we are currently working on include:
- Unit tests, extensive code style checks (e.g. pylint/tox/tslint)
- The backend foundation for populating the REST API based on the openATTIC data structures (PR#26)
- A simple authentication mechanism based on a freely definable username and password (backend - PR#13) (UI - PR#27)
- Support for storing dashboard-specific configuration settings in the MON persistent storage (PR#46)
- Handling session expiry when closing the user's browser (PR#44)
- A page displaying the cluster's overall health status and various related runtime information (PR#31)
- A page listing the cluster's hosts (servers) and their details (PR#38)
- Ceph Object Store (aka RADOS Gateway) management (WIP)
- Grafana proxy implementation to embed Grafana dashboards into the UI (WIP)
- Ceph Pool list and creation (WIP)
- Ceph RBD Mirroring page (WIP)
- Ceph Filesystems (WIP)
- Ceph Monitors (WIP)
If you have any questions or would like to help, don't hesitate to contact us!
The easiest way to get in touch with the team and to follow the ongoing development of the module is to join the #openattic IRC channel on Freenode.
We're available on the Ceph community communication channels as well (e.g. IRC channels, mailing lists) - we look forward to your feedback and comments!
We also have two weekly conference calls where we discuss the progress and open issues. If you're interested in joining, please get in touch with John Spray or myself for details.
Comments
Comments powered by Disqus