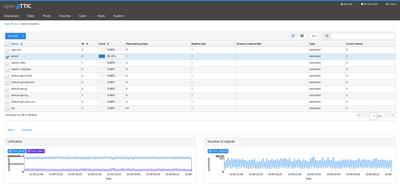
With the release of openATTIC version 2.0.14 this week, we have reached an important milestone when
it comes to the Ceph management and monitoring capabilities. It is now possible
to monitor and view the health and overall performance of one or multiple Ceph
clusters via the newly designed Ceph cluster dashboard.
In addition to that, openATTIC now offers many options to view, create or delete
various Ceph objects like Pools, RDBs and OSDs.
We're well aware that we're not done yet. But even though we still have a lot of
additional Ceph management features on our TODO list,
we'd like to make sure that we're on the right track with what we have so far.
Therefore we are seeking feedback from early adopters and would like to
encourage you to give openATTIC a try! If you are running a Ceph cluster in your
environment, you could now start using openATTIC to monitor its status and
perform basic administrative tasks.
All it requires is a Ceph admin key and config file. The
installation of openATTIC for Ceph
monitoring/management purposes is pretty lightweight, and you don't need any
additional disks if you're not interested in the other storage management
capabilities we provide.
We'd like to solicit your input on the following topics:
- How do you like the existing functionality?
- Did you find any bugs?
- What can be improved?
- What is missing?
- What would be the next features we should look into?
Any feedback is welcome, either via our Google Group, IRC or our public Jira
tracker. See the get involved page
for details on how to get in touch with us.
Thanks in advance for your help and support!


